From the mid-1890s to the First World War, one of the more
successful "UTC Companies" bore the name Al. W. Martin (sometimes coupled with Ed. R.
Salter's, eventually coupled with Wm. Kibble's). Martin created a second
company in 1898 and began advertising the show as a "$25,000 investment,"
featuring "3 magnificent brass bands, 60 people on stage, and 25 ponies,
mules, oxen and horses."
For some reason, Billboard magazine paid particular
attention to Martin's show, regularly publishing the itineraries of both the
"Eastern" and the "Western" companies. From those published schedules, we've
created interactive maps of two different seasons on the road – 1901-1902
and 1911-1912. The itineraries were probably sent in to Billboard by the
traveling managers, and likely are incomplete, but the maps will
allow you to see what parts of the U.S. were visited by these troupes.
The maps and accompanying data are delivered through a
software program developed by alta4 Geoinformatik AG. This does not
require a plug-in, and is very user-friendly. Similarly, the information we've
encoded inside the maps should explain itself, so feel free to
LAUNCH TOUR
MAPS
now. The material that follows is for anyone who'd like more orientation first.
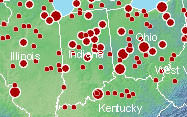
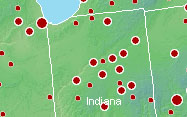
 There are 7 maps altogether. The first one (see detail above
left) is a composite displaying all the cities and towns listed in all four sets of itineraries.
Many of these places were visited in both 1901-02 and 1911-12. The size of each dot indicates the
total number of days Martin's played at that spot. From this first page you can access the other six
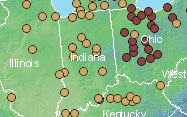
maps. The Eastern and Western companies are displayed together on composite maps for 1901-02
(above center) and 1911-12; here the color of the dot indicates the company. And each
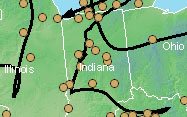
company's tour also has its own map (above right), where the directional progress of the tour
is indicated by a line. TEXT links enable you to display schedules for either season.
There are 7 maps altogether. The first one (see detail above
left) is a composite displaying all the cities and towns listed in all four sets of itineraries.
Many of these places were visited in both 1901-02 and 1911-12. The size of each dot indicates the
total number of days Martin's played at that spot. From this first page you can access the other six
maps. The Eastern and Western companies are displayed together on composite maps for 1901-02
(above center) and 1911-12; here the color of the dot indicates the company. And each
company's tour also has its own map (above right), where the directional progress of the tour
is indicated by a line. TEXT links enable you to display schedules for either season.
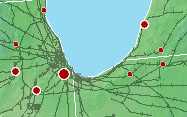 You can enlarge each map twice, to 200% and to 400%. On the enlarged
maps, arrows at the
edges of the maps allow you to scroll across them. At the last level
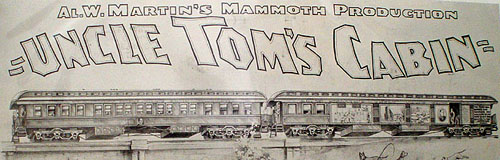
(above right) the map also displays rail lines. As illustrated at the top of this page, each Martin
company – casts, crews, animals,
sets and other equipment – traveled in a pair of customized train cars, so where the tracks could take
them is an important part of the
story of where this particular production went – and where it didn't go. (The data on the rail lines is from a mid-20th
century map, but as far as we've been able to tell, it also pretty accurately depicts the routes available at the
beginning of the century.)
You can enlarge each map twice, to 200% and to 400%. On the enlarged
maps, arrows at the
edges of the maps allow you to scroll across them. At the last level
(above right) the map also displays rail lines. As illustrated at the top of this page, each Martin
company – casts, crews, animals,
sets and other equipment – traveled in a pair of customized train cars, so where the tracks could take
them is an important part of the
story of where this particular production went – and where it didn't go. (The data on the rail lines is from a mid-20th
century map, but as far as we've been able to tell, it also pretty accurately depicts the routes available at the
beginning of the century.)
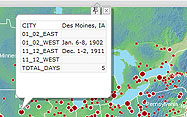
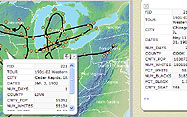 Moving the cursor over any dot on any map pops up information about both the place and
the performance. On the composite map (left), all the dates Martin's played there, with the
names of tours and
total number of days, are given. On the more specific maps, the balloon includes local population figures
from either the 1900 or the 1910 U.S. Census, and how that population was
distributed by race. Census information was aggregated by county, not city or town, so
also given is the name of the county, along with whether the town Martin's played in was the
county seat. In some of its promotional notices during this period, Martin's boasted that it was
"the only Uncle Tom's Cabin Company that plays larger cities." In these venues
they often stayed for a whole week, and with matinees probably did at least 10
shows. But as you'll see from the maps, they played plenty of towns too;
typically, these were county seats.
Moving the cursor over any dot on any map pops up information about both the place and
the performance. On the composite map (left), all the dates Martin's played there, with the
names of tours and
total number of days, are given. On the more specific maps, the balloon includes local population figures
from either the 1900 or the 1910 U.S. Census, and how that population was
distributed by race. Census information was aggregated by county, not city or town, so
also given is the name of the county, along with whether the town Martin's played in was the
county seat. In some of its promotional notices during this period, Martin's boasted that it was
"the only Uncle Tom's Cabin Company that plays larger cities." In these venues
they often stayed for a whole week, and with matinees probably did at least 10
shows. But as you'll see from the maps, they played plenty of towns too;
typically, these were county seats.
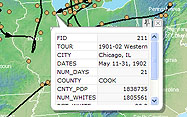
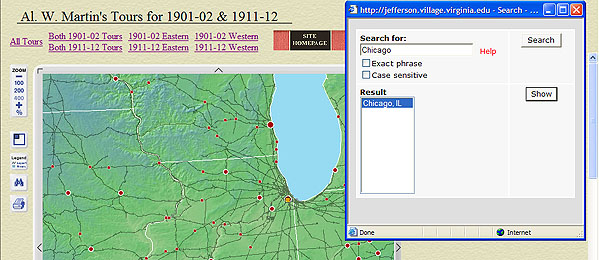
If you click on a dot, you can use the thumbtack button to fix data balloons alongside
the map (above right), and continue to look closer at other stops along a tour.
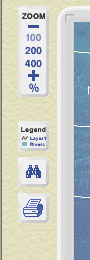
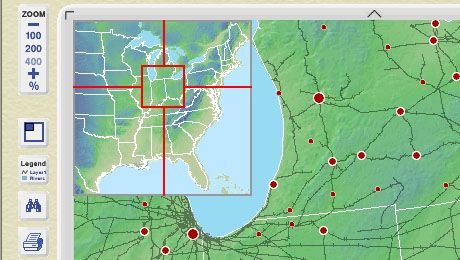 The function buttons along the left side of each map (above left) follow web conventions, but
one feature to notice is that when you've enlarged a map a new button appears, that allows you to bring up an
"overview map" locating the area of the larger map currently on display in the window (above right). Clicking on the
binoculars brings up a new window (see below), where you can enter and "Search" for a city or state
name; if
that name is in the data base, "Show" will highlight that place on the map (as Chicago is highlighted here).
The function buttons along the left side of each map (above left) follow web conventions, but
one feature to notice is that when you've enlarged a map a new button appears, that allows you to bring up an
"overview map" locating the area of the larger map currently on display in the window (above right). Clicking on the
binoculars brings up a new window (see below), where you can enter and "Search" for a city or state
name; if
that name is in the data base, "Show" will highlight that place on the map (as Chicago is highlighted here).
If you're interested, the Census reports from 1900 and 1910 contain a lot more information about
each of the counties in which Martin's show performed. For that, see the Historical Census
Browser at the University of Virginia's Geostat Center. For the Martin tours,
LAUNCH MAPS
|